

The power of thought is great, the power of imagery is greater.
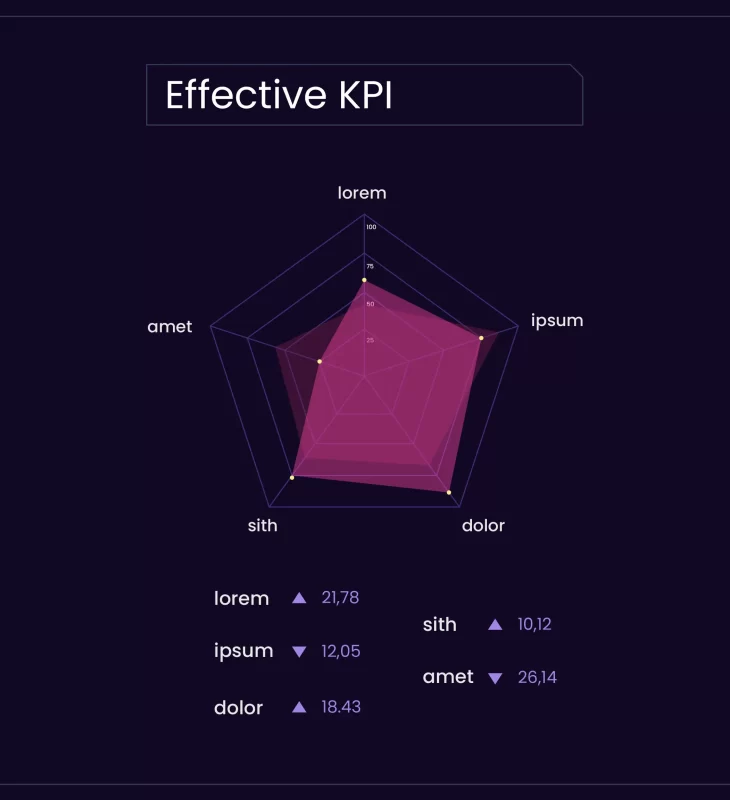
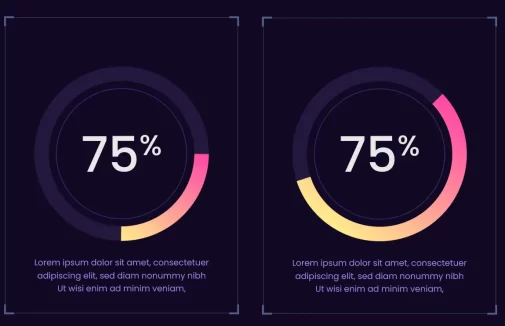
At Bigwave, our goal is to fuse together marketing strategy with top-tier creative production that drives major digital marketing results. This is why we use a combination of inbound marketing methods to convey your message. Infographics are the perfect way to give an easy-to-understand overview of a topic, using an enticing representation of information and data visualisation.


Capture user’s attention and multiply your reach.
Bigwave’s innovative graphic designers create stunning infographics to captivate your target audience. We can present your data in charts and flows with the help of interesting shapes and graphics, or simply use striking visuals to communicate information in a unique and engaging way. Attention grabbing content leads to better visibility and recall value for your brand.

How infographics can improve your brand awareness:

The ways you can use infographics are endless, but here are a few examples:
Represent a promotion
Explain a concept or process
Tell a visual story
Raise awareness of an issue or cause
Provide a quick overview of a topic
Explain a complex process
Display research findings or survey data
Summarise a long blog post or report
Compare and contrast multiple options


