Google Analytics is a free resource which, when linked to your website, can provide a wealth of incredibly useful information about the visitors to your site. From things as simple as visitor numbers and search terms used to reach your site, to more complex data such as the monetary value of your social media referrals, Google analytics can answer a lot of questions about your website. Here are five statistics that you should be checking on Google Analytics.
1. Mobile traffic

Google Analytics can tell you what percentage of your web traffic is from a mobile or tablet device (you can even see which particular models have been used to visit your site if you so wish!). You may be surprised how much of your traffic comes from mobile sources. If it’s more than you imagined, and your site isn’t mobile friendly, now may be the time to re-assess this!
2. Frequency and Recency

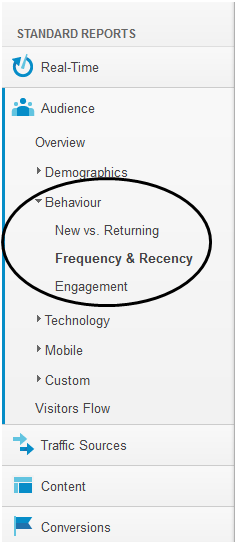
The frequency and recency data is important if you want to find out how useful your visitors find your website. A high percentage of returning visitors suggests that they know to come to your website for a particular service or piece of information. Conversely, a high percentage of one-time visitors indicates that the information people are visiting your site hoping to find, is not there.
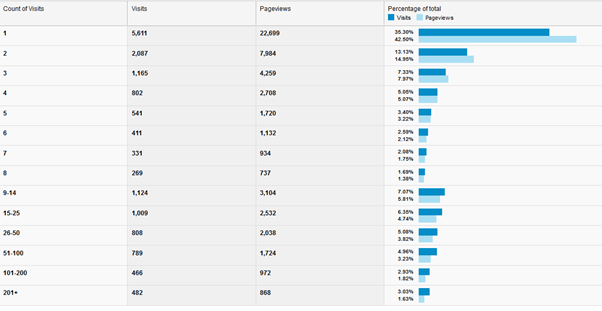
The frequency and recency table collates how many time each visitor has come to your website, the total of page views looked at, and the percentage of the total the visits and page views make up.

This example shows that although 35% of visitors have just visited once, the majority have returned to the site: a sign of positive engagement.
3. Goal setting
There is a bit of a myth that goal setting is only useful for eCommerce sites; there are so many other reasons to set up goals.
Basically a ‘goal’ is a way to track individual actions, such as someone visiting a set number of pages on a site. Each time a user completes a Goal, a conversion is logged to your account. You can see the Goal conversion rates in the Goal reports, and get further analysis in other reports such as the Visitor Report or Traffic Report.
There are four different objectives you can choose for a Goal:
URL Destination: This records a conversion when someone visits a specified location. So for example, if you have a form registering interest for a product or service, you could set up a Goal for the ‘Thank you’ page, which would track how many people had filled in the form.
Visit Duration: You can set a goal for visits that last a specific amount of time.
Page/Visit: You can set a goal to find out how many visitors go to a number of pages or screens in one visit.
Event: This goal can only be set once ‘Event Tracking’ has been set up. Once this has been done, you can set up goals to record actions you’ve defined as an Event, such as a social recommendation or an ad click.
To set one up, visit the admin settings and bring up your profile. ‘Goals’ is one of the headings in the menu.
4. Bounce rate
The bounce rate of your site represents the percentage of visitors who enter the site and then leave it, rather than continue to view other pages within the same site. The metric can be found on the landing page of Google Analytics, or Audience Overview in the menu. The bounce rate is often used to help determine the effectiveness of an entry page. An entry page with a low bounce rate means that the page effectively causes visitors to view more pages and continue deeper into the website.
According to KISSmetrics, the average bounce rate for a website is 40.5%. As a rule of thumb, if your bounce rate goes above 60% you should be concerned that your website is not providing the information that your audience are looking for.
If this is the case, take a look at your search referrals and what terms are being used to reach your website. If you have Google webmaster tools linked to your website as well, have a look at your keywords. This should give you an idea whether the content of your website is reflective of the service you provide, and whether you need to re-assess what’s on there.
However, a high bounce rate does not always suggest a poor performing website. For example, a visitor looking for the definition of a word may enter an online dictionary on that word’s definition page. Similarly, a visitor who wants to read about a specific news story may enter a news site on an article written for that story. These example entry pages could have a very high bounce rate, but still be considered successful.
5. Social media referrals

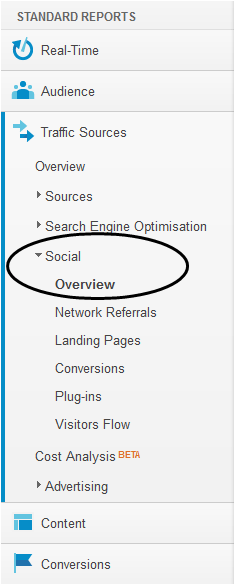
If one of your objectives when using social media is to drive traffic to your website, you are able to track this on Google Analytics.
You can also ink this metric with your goals. So for example, if you have a new downloadable document that you are only promoting through social media, you can set this up as a goal URL and precisely track how effective your social media marketing has been.
For more information on the content marketing and analysis service provided by Bigwave Media please contact [email protected].

